MATCH OF THE DAY: Foreign Direct Investment: Britain v the EU
7 Smart Facts
1) Scores
Britain’s score barely moved. In 2014 the UK stood on 17.72% FDI/GDP. By 2024 it was on 17.90%. That is not a breakout. It is stagnation.
Over the same period, the EU normative average moved from 20.44% to 21.20%, France from 21.84% to 21.93%, Germany from 20.16% to 21.05%, and Italy from 17.08% to 22.35%. In the post-referendum period from 2017 to 2024, the deeper picture is worse for Britain: the UK averaged 17.96%, against 22.71% for the EU average, 22.92% for France, 21.64% for Germany, and 20.62% for Italy.
2) Ranks
The full table tells the story brutally. Britain was 23rd in 2014, 25th in the referendum year, and 26th by 2024 out of the 29 rows in the supplied league file.
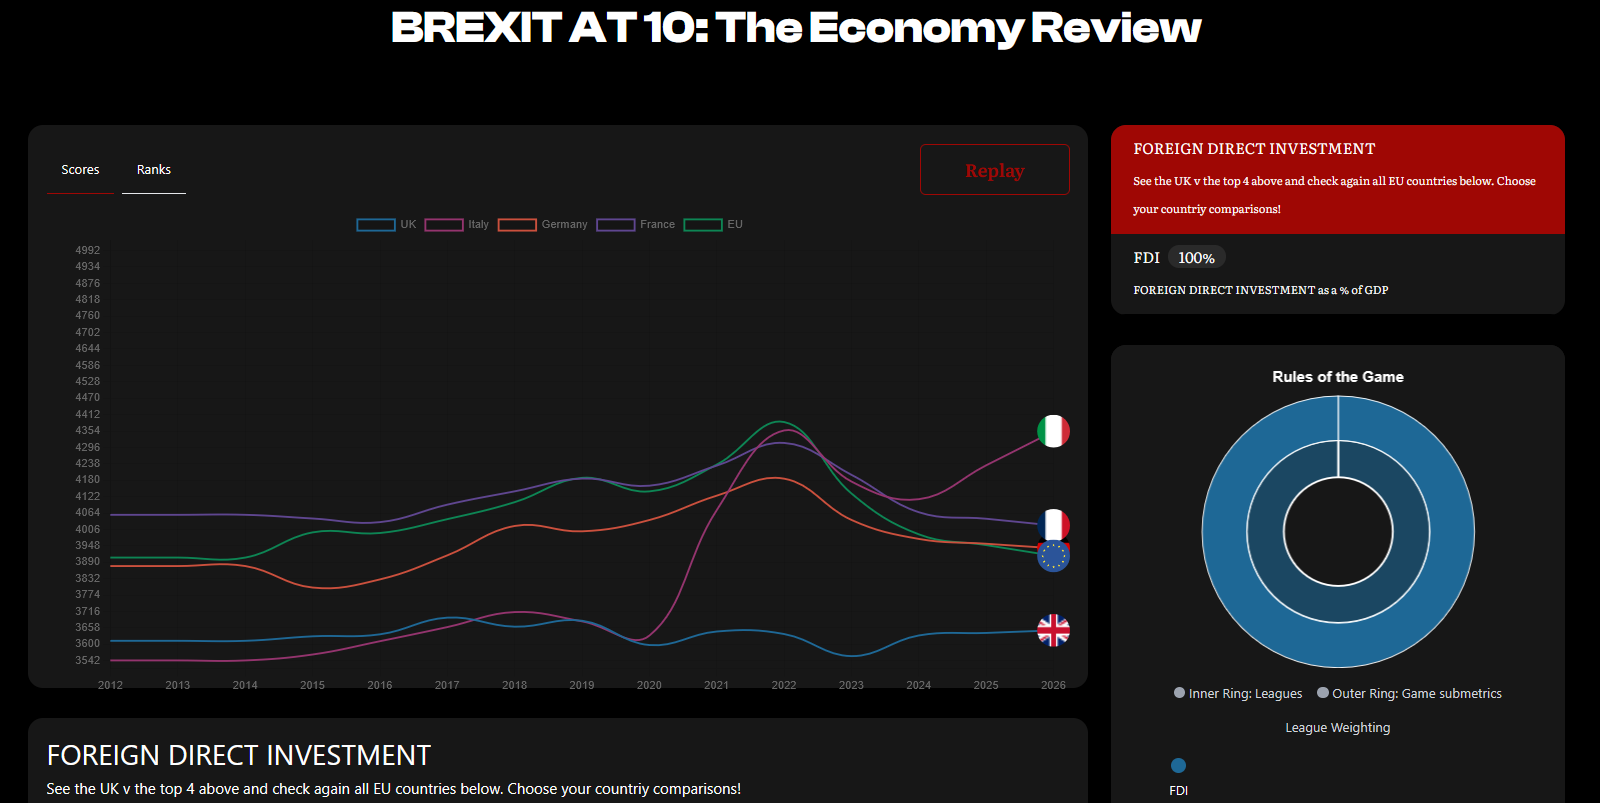
Inside the public-facing top-five comparator set, that means Britain moved from 4th of 5 to 5th of 5. France and the EU average were already ahead and stayed ahead. Germany stayed above Britain throughout. The real humiliation is Italy: once behind Britain, it is now well clear.
3) Score squeeze
This is the heart of the Brexit story on FDI. The EU average beat the UK in all 11 years from 2014 to 2024. So did France. So did Germany. In the post-referendum window, the EU sat on an average advantage over Britain of roughly 4.75 percentage points. France’s average lead was roughly 4.96 points. Germany’s was about 3.68 points. Britain did not lose this contest in one dramatic collapse. It lost it by being consistently, repeatedly, structurally behind the European field it said it could outperform.
4) Rank crossover
The crossover that matters most is Italy. Britain stayed marginally ahead of Italy from 2014 to 2017. Italy moved ahead in 2018, slipped back to near-parity in 2019, and then moved decisively clear from 2020 onward. By 2021 the gap had become visible. By 2024 it was emphatic: Italy stood 4.45 points above Britain. So the structural loss in this league is not to the EU average, France, or Germany — they were already ahead. It is the loss of relative position to a recognisable peer that many British readers still instinctively think of as weaker.
5) Form
Britain’s form line was not a dramatic collapse. It was something more politically awkward: a flat, narrow, unconvincing band. Between 2014 and 2024 the UK had 6 rising years and 4 falling years, but it stayed trapped between a low of 17.22% and a high of 18.48%. That is not the profile of a country generating a new investment model after a strategic break. It is the profile of a country moving around without gaining ground.
6) Winners and losers
The winner in this league is Italy, because it is the country that most clearly changes the story of the table. The quiet system winner is the EU average, which remains comfortably above Britain throughout. France is the steady upper-tier performer. Germany is not spectacular, but it still beats Britain every year in the supplied range. Britain’s result is therefore very specific: it is not the absolute basket case of Europe, but it is the main loser of relative attractiveness inside the public comparator set. It is the country that was supposed to prove its freedom through superior magnetism and instead finished last of the five.
7) Forecast
The forecast is the hardest part to read because it does not show dramatic British collapse. It shows managed stagnation. By the end of the file’s forward path in 2028, the UK edges up only slightly to 18.22% and sits 5th of the 5-country comparator group, still below the EU norm, France, Germany, and far below Italy. The EU average itself softens, and Germany is hardly dynamic, but Britain still does not close the gap. That is what makes the forecast politically damaging: not catastrophe, but failure to catch up.
7 SMART RULES
The 7 smart facts told us what happened. The 7 smart rules tell us why. On foreign direct investment, the answer is not simply that Britain made one bad decision and Europe made one good one. It is that the UK chose a model of sovereignty-plus-agility that required exceptional policy clarity, exceptional political stability, and exceptional capital attraction after leaving the single market. It got none of those at the level required. The EU, by contrast, kept the larger field, the deeper market, and the heavier institutional ballast. Source
Brexit turned Britain into a smaller-field player at exactly the point when investment competition started rewarding the opposite: scale, regulatory depth, predictable rules, integrated capital markets, and long-run policy continuity. The live dashboard already shows the result. In the top-five public comparator set, Britain sits last by 2024 on 17.90% FDI/GDP, below the EU average (21.20), Germany (21.05), France (21.93), and now well below Italy (22.35). The issue is not that Britain attracts no capital. The issue is that it is not attracting capital like the post-Brexit growth story said it would.
The wider evidence fits that pattern. The OBR still assumes Brexit leaves UK long-run productivity 4% lower than remaining in the EU would have done, with both exports and imports around 15% lower in the long run than otherwise. The ONS’s 2024 FDI bulletin shows the UK’s inward FDI position fell by £75.4 billion in 2024 to £2,127.6 billion, while inward FDI flows fell by £27.9 billion to £13.4 billion. None of that proves a one-variable Brexit story on its own. But together with the league table, it does show a country still searching for a stable post-Brexit investment advantage.
Distilling the FDI result through the 7 rules of power shows why the verdict is harsher than the raw numbers first appear. Like any football side, a country can survive for a while on brand, habit, and old strengths. But if the game changes and the structure beneath the team is wrong, the table eventually tells the truth.
1 ⚫ TEAM TALK — Gameplan
Rules 1 & 2: What is the foreign direct investment plan? Who’s delivering it?
Rule 1: Do You Have A Plan?
Britain’s plan was clear in pitch but weak in architecture: leave the EU, recover flexibility, lighten the regulatory burden, and become a more globally attractive destination for capital. The problem is that FDI is not won by slogans about nimbleness alone. It is won by offering investors a platform with scale, certainty, skilled labour, infrastructure, market access, and confidence that the rules will not keep changing. On this metric, the EU’s plan looks duller but stronger: keep the single market, deepen capital-market integration, and make the continent easier to finance at scale. The European Commission’s 2025 consultation on integrating EU capital markets is explicit about that goal. The table backs it up: the EU average stayed above Britain every year in the supplied range. Verdict: the EU had the better investment plan.
Rule 2: Is Your Leadership Strong?
The UK’s post-referendum record is a study in rewrites. Prime ministers changed, fiscal strategies changed, immigration signalling changed, industrial policy changed, and the growth model itself kept being reframed. The existence of a new Modern Industrial Strategy promising certainty and stability for long-term investment is itself revealing: it is an attempt to restore precisely what the post-Brexit period unsettled. The EU, for all its bureaucracy, retained strategic continuity. It kept the big field together. Verdict: Britain had more political motion; Europe had more investment continuity.
2 ⚫ ATTACK — 1st half
Rules 3 & 4: Is the economy strong enough to win the game? What are our tactics?
Rule 3: Are You Deploying the Right Powers to drive foreign direct investment?
Britain still has real powers in this game: a strong legal system, deep financial expertise, world-class universities, a global language, serious professional services, and a reputation for commercial competence. Those are not trivial. But FDI is not just about prestige assets. It is about whether foreign capital can see a broad route into growth. The EU’s advantages are wider: continental market size, embedded supply chains, regulatory reach, and the possibility of spreading investment across a deeper economic field. That is why Britain can still look attractive in theory while underperforming in the ranking. Verdict: Britain is still a sharp asset base; the EU is the broader investment platform.
Rule 4: Are Your Policies Right?
This is where the border matters most. The OBR’s standing judgment is that Brexit raises non-tariff barriers, leaves trade lower than it otherwise would have been, and lowers long-run productivity. That matters to FDI because foreign investors do not just buy today’s profit stream; they buy tomorrow’s expected access, efficiency, and scale. A country that increases friction with its largest nearby market has to compensate elsewhere with extraordinary clarity and performance. Britain has not done that. The EU has policy frictions of its own, but they happen inside a larger home market rather than across a new external border. Verdict: Britain’s policies made the investment pitch smaller.
🟨 HALF-TIME: Europe leads on structure
At half-time, the EU leads because modern investment competition rewards structure more than romance. Britain still has high-value sectors and a recognisable commercial brand. But the table says that brand has not translated into superior FDI performance against the peers most British readers care about.
| First-half rules | UK | EU | Verdict |
|---|---|---|---|
| Rule 1: Plan | 4/10 | 7/10 | EU clearer |
| Rule 2: Leader | 5/10 | 7/10 | EU steadier |
| Rule 3: Power | 6/10 | 8/10 | EU broader |
| Rule 4: Policies | 4/10 | 7/10 | UK carries more friction |
3 ⚫ DEFENCE — 2nd half
Rules 5 & 6: Can you innovate? What are the opposition’s tactics?
Rule 5: Are You Innovating Quickly Enough?
Britain’s case has always been that freedom from the EU would allow faster adaptation: quicker regulation, quicker approvals, quicker pivots, quicker capital formation. But FDI is interested not in rhetoric about speed, but in whether innovation can be converted into scalable opportunity. This is where the EU’s own weakness is real: it often regulates more elegantly than it commercialises. But Britain’s weakness is different and more damaging for this metric. It can generate ideas, yet struggle to convert them into broad, continent-scale investment stories once market access becomes more complicated. The EU’s answer is to deepen its capital markets. Britain’s answer is still evolving. Verdict: Britain may still be faster in patches, but Europe remains bigger where it counts.
Rule 6: Are Rivals Outpacing You?
The central trap is now obvious. Britain tried to become more investable by stepping outside the European system while assuming its old strengths would be enough to offset the loss of automatic scale. The result has been a smaller investment field with more pressure on domestic policy to compensate. The ONS’s 2024 bulletin underlines how important Europe still is: the EU was the only region where the value of the UK’s outward FDI position was lower in 2024 than in 2023, falling by £161.7 billion. That does not mean “Brexit caused everything.” It does mean the European field remains strategically central, whether Britain likes it or not. The EU’s trap is different: fragmentation within size. But it is trying to solve that by completing integration, not by walking away from it. Verdict: the UK imposed a strategic handicap on itself; the EU still suffers bulk without full cohesion, but it kept the larger game.
4 ⚫ FINAL WHISTLE
Rule 7: Did the gameplan work?
In the end, the scoreboard decides. Britain averaged 17.96% FDI/GDP from 2017 to 2024. The EU averaged 22.71%. France averaged 22.92%. Germany averaged 21.64%. Italy averaged 20.62% and pulled away hard after 2020. Britain did not just fail to lead. It finished bottom of the public comparator set by 2024. That does not support the claim that Brexit created a more magnetic platform for foreign capital than the European system Britain left. Source
| Final scorecard | UK | EU |
|---|---|---|
| Rule 1: Plan | 4 | 7 |
| Rule 2: Leader | 5 | 7 |
| Rule 3: Power deployment | 6 | 8 |
| Rule 4: Policies | 4 | 7 |
| Rule 5: Innovation | 5 | 6 |
| Rule 6: Rivals / traps | 4 | 6 |
| Rule 7: Final result | 3 | 7 |
| Total | 31/70 | 48/70 |
7 smart rules verdict
The score is clear enough. Britain has not been wiped off the field. It still has strong institutions, serious sectors, and moments of real attractiveness. But across the seven smart rules, the pattern is there for anyone willing to read the match properly: the plan was too thin, the leadership too unstable, the powers too narrow for the task set, the policies too friction-heavy, the innovation story too weakly converted into broad capital attraction, and the rival field too large to dismiss. That is why the final rule matters most. It is the result on the board. And the result says Britain has not turned post-Brexit freedom into superior investment pull. It has fallen behind the system it said it could beat.
But a rules verdict only tells you why this match was played badly. It does not tell you the more dangerous thing: whether Britain is just in a weak passage of form, or whether this is the sort of structural warning that appears when countries enter a deeper cycle of pressure and decline. For that, we move from the seven smart rules to the seven smart cycle stages. Because like teams, like economies, like states, countries build, gather momentum, peak, come under pressure, overreach, and then either adapt or slide. The cycle is where that secret sits.