The World Bank has just announced the latest economic growth figures, and this is what they mean. Economic growth tracks the yearly change in GDP, so this is the scoreboard for how fast each economy is really growing, not just how expensive things have become.
And that is why these numbers matter to Brexit. Nearly ten years on, this is the real match report: if leaving the EU was meant to restore British economic dynamism, then the growth figures show whether Brexit actually made Britain quicker, stronger, and more competitive than France, Germany, Italy, and the EU average — or whether it slowed the country down instead.
MATCH OF THE DAY: Britain v the EU
7 Smart Facts
1) Scores
Britain began strongly and faded. In 2014 the UK led this group on growth with 3.19%. By 2024 it had fallen to 1.10%. That still left it ahead of Germany and Italy, but behind both France and the EU average, which reached 1.62%. In the post-referendum years, the deeper picture is worse: from 2017 to 2024 the UK averaged 1.29%, well below the EU average of 2.48%.
2) Ranks
The table tells the story quickly. Britain went from 1st to 3rd. France climbed quietly. Germany slid badly. The EU average, despite all its frustrations, ended ahead of Britain.
| Country | Growth |
|---|---|
| France | 1.24% |
| Italy | 0.62% |
| UK | 0.35% |
| EU | 0.29% |
| Germany | -1.50% |
3) Score squeeze
This is the heart of the Brexit story. The EU beat the UK in 8 of the 11 years between 2014 and 2024, by an average margin of +0.97 percentage points. This is the “Brexit squeeze”: Britain did not collapse, but its growth edge was clipped. Official evidence reinforces that story: the OBR’s long-run view is that Brexit reduces UK productivity and leaves trade intensity weaker than it would otherwise have been.
4) Rank crossover
The crossover years matter because they mark structural loss, not just one bad season. The EU moved ahead in 2015. France moved ahead in 2018. Britain surged in the Covid rebound, but that recovery did not hold. By 2023 and 2024, the new order was visible again: Britain was no longer the pace-setter.
5) Form
Britain’s form line was not a steady collapse. It was worse in one sense: it was erratic. Between 2014 and 2024 the UK had 4 rising years and 6 falling years. That is not the pattern of a country with a settled growth model. It is the pattern of a country with bursts of energy but no stable trend advantage.
6) Winners and losers
The winner in this league is the EU average, not because Europe is booming, but because it retained enough scale and continuity to outpace Britain. France is the quiet climber. Germany is the biggest underperformer. Britain’s result is more subtle: it is not the basket case, but it is the main loser of leadership. It gave up top place and has not recovered it.
7) Forecast
The forecast is the hardest part to read. Britain does not look headed for dramatic collapse. It looks headed for middling growth. By 2030, the report’s projection has the UK at 0.35%, behind France and only modestly ahead of an EU average dragged down by Germany. That is not disaster. It is something politically worse: managed underperformance.
|
Forecast
rank to 2030 |
Growth |
|
France |
1.24% |
|
Italy |
0.62% |
|
UK |
0.35% |
|
EU |
0.29% |
|
Germany |
-1.50% |
The forecast table does not show British revival. It shows lower growth almost everywhere, with France and Italy the standout relative winners and Germany the clear laggard.
But the average projection over the next few years shows only Germany threatening to drag the EU down. So the time machine says Britain remains a middling grower: not the sick man of Europe, but not the winner either.
Match report:
Brexit did not kill Britain’s economic growth in absolute continental terms. It killed Britain’s claim to be outperforming the European system it left. Britain still beats Germany cleanly, still edges Italy, and stays close to France. But the EU average is the real control group here, and Britain lost that contest. It lost it on average growth, on ranking position, and on structural leadership after 2014.
The growth story, then, is not decisive — which makes the next question decisive. What does this mixed Brexit record mean for Britain’s overall economic power? Is post-Brexit Britain proving itself a smart power or a stupid one? To find out, we have to judge its performance against the seven smart power rules.
The 7 smart facts told us what happened. The 7 smart rules tell us why. The answer is not simply that Britain made one bad choice and Europe made one good one. It is that the UK chose a model of sovereignty-plus-agility that required near-perfect execution, while the EU retained a model of repair-through-scale that gave it more margin for error.
Brexit turned Britain into a smaller-field player at exactly the point when the global growth game started rewarding the opposite: scale, capital depth, energy coordination, market integration, and strategic resilience. Britain kept a real capacity for high-end growth but it also accepted more trade friction with the market next door. That trade-off sits underneath the whole post-Brexit growth story. The Office for Budget Responsibility still assumes Brexit leaves UK productivity 4% lower in the long run than EU membership would have done, and both imports and exports about 15% lower than they otherwise would have been. That is not spin. That is the strategic handicap this match has been played under.
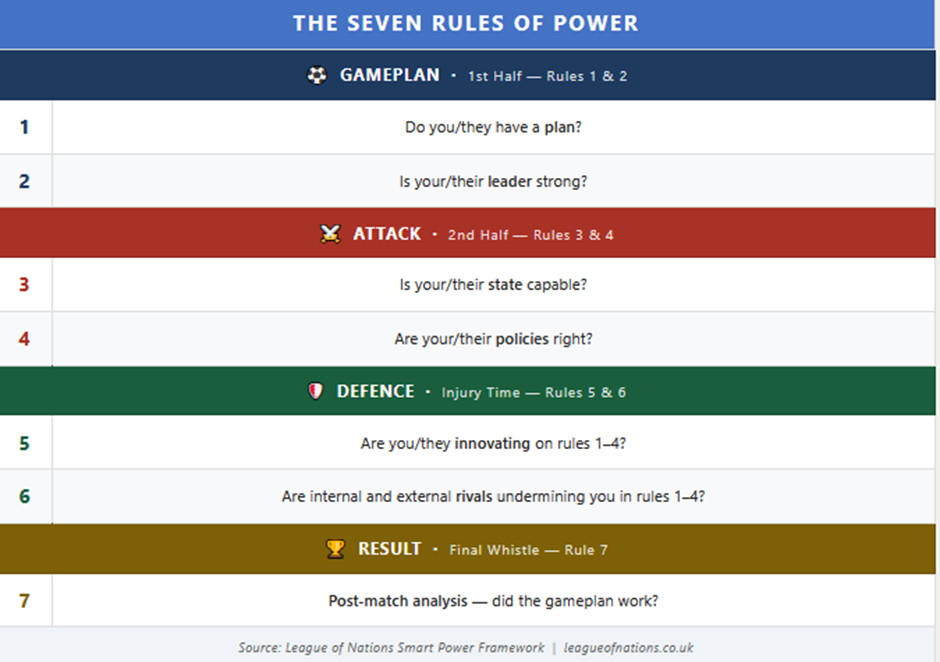
Distilling all its conclusions through the 7 rules of power shows that the diagnosis is grim. Like in any football game you need a smart gameplan, a strong attack and a sturdy defence.
1 ⚫ TEAM TALK — Gameplan
Rules 1 & 2: What is the economic growth plan? Who's delivering it?
Rule 1: Do You Have A Plan?
Britain’s plan was clear in rhetoric but weak in execution: leave the EU, recover flexibility, and grow faster. The EU’s plan was less glamorous but more robust: absorb shocks, repair bottlenecks, and use scale to stay competitive. The evidence is the table itself: Britain fell from 1st to 3rd, while the EU average stayed ahead. Verdict: the EU had the better plan.
Rule 2: Is Your Leadership Strong?
The UK suffered repeated rewrites, elite division, and investment uncertainty. The EU, whatever its bureaucracy, benefited from continuity. It kept running the same game even when the football was ugly. Verdict: Britain had more political noise; Europe had more strategic continuity.
2 ⚫ ATTACK — 1st half
Rules 3 & 4: Is the economy strong enough to win the game? What are our tactics?
Rule 3: Are You Deploying the Right Powers to drive economic growth?
Britain’s strengths are real, but narrow: finance, services, universities, legal credibility. The EU’s strengths are broader: market size, trade reach, regulatory scale, and the ability to shape the field. In growth contests, broad scale usually beats isolated excellence. Verdict: Britain is sharp; the EU is wide.
Rule 4: Are Your Policies Right?
This is where the border matters. Britain tried to gain policy freedom, but in practice it increased friction with its largest nearby market. The result was not liberation into faster growth, but a drag on trade intensity and business confidence. The EU also has policy problems, but its problems happen inside a larger field. Verdict: Britain’s policies made the pitch smaller.
🟨 HALF-TIME: The EU leads on structure
At half-time, the EU leads because it has the better structure. Britain still has flashes of technical quality, but modern growth rewards depth, continuity and scale more than flair alone.
|
First-half
rules |
UK |
EU |
Verdict |
|
Rule 1: Plan |
5/10 |
7/10 |
EU clearer |
|
Rule 2: Leader |
6/10 |
7/10 |
EU steadier |
|
Rule 3: Power |
6/10 |
8/10 |
EU broader |
|
Rule 4: Policies |
5/10 |
7/10 |
UK carries more friction |
3 ⚫ DEFENCE — 2nd half
Rules 5 & 6: Can you innovate? What are the opposition's tactics?
Rule 5: Are You Innovating Quickly Enough?
This is more complicated than the clichés suggest. The EU is not a perfect innovation machine; it often regulates more confidently than it scales new champions. But Britain’s position is still worse than the Brexit case promised. Innovation works best when it can be commercialised across a deep market. The UK is still good at producing ideas, but weaker at converting them into broad growth without friction. Verdict: Britain may be faster on paper, but Europe is bigger in practice.
Rule 6: Are Rivals Outpacing You?
The central trap is obvious in hindsight: Britain made growth harder by adding friction to the market that mattered most. This is the Brexit trap. After years of promising freedom from state-heavy economic management, it is now back to industrial policy, infrastructure, skills, planning, targeted finance, energy coordination, and a more practical recognition that access and alignment matter. That may be sensible. In fact it probably is. But it proves the original growth model did not work as advertised.
The EU’s trap is different: sclerosis, not separation. The EU, by contrast, is not flipping away from integration. It is trying to complete it.
Britain’s challenge is to regain usable scale; Europe’s is to turn scale into dynamism. Verdict: the UK imposed a strategic handicap on itself; the EU suffers from bulk without enough speed.
4 ⚫ FINAL WHISTLE
Rule 7: Did the gameplan work?
In the end, the scoreboard decides. Britain averaged 1.29% growth in the post-referendum window against the EU’s 2.48%. That does not support the claim that Britain would outperform the system it left.
|
Final
scorecard |
UK |
EU |
|
Rule 1: Plan |
5 |
7 |
|
Rule 2: Leader |
6 |
7 |
|
Rule 3: Power deployment |
6 |
8 |
|
Rule 4: Policies |
5 |
7 |
|
Rule 5: Innovation |
5 |
6 |
|
Rule 6: Rivals / traps |
4 |
6 |
|
Rule 7: Final result |
3 |
6 |
|
Total |
34/70 |
47/70 |
7 smart rules verdict
The score is clear enough. Britain has not been thrashed. It still has good players, moments of flair and some serious assets. But across the seven Smart Rules, the pattern is there for anyone willing to read the match properly: the plan has been too thin, the leadership too erratic, the powers too narrow, the policies too friction-heavy, the revolutions too weakly converted into broad growth, and the rival too large to ignore.
That is why the final rule matters most. It is the result on the board. And the result says Britain has lost its growth edge. But a match report only tells you how this match was played. The rules tell you what went wrong. What they do not tell you is the more dangerous thing: whether this is just a bad run of form, or the point in the season when strong countries start sliding towards decline. For that, we move from the seven Smart Rules to the seven Smart Cycle stages. The Smart Cycle is where that secret sits.
Because like life, like teams, all great powers move through cycles. They build, gather momentum, become contenders, reach a zenith, then encounter pressures. After that comes overreach and decline unless tactics change in time to rebuild.
The Situation Report reveals how Britain can revive not slip into the relegation zone. Because this is where the real Smart Power knowledge begins.
You'll see the countries who played the same match as Britain. And you'll see who played smart power and won, and who played stupid power and lost.