WHY IS ECONOMIC POWER VITAL TO A GRAND STRATEGY?
Economic power is your midfield general. It’s the player who dictates the tempo, links defence to attack, and decides whether your team controls the game or spends 90 minutes chasing shadows. It's the lifeblood of your grand strategy.
A strong economy means:
- You control possession (resources)
- You shape the game (influence)
- You can switch play and change tactics (strategic flexibility)
A weak economy means:
- You’re reactive, not proactive
- You’re forced into long balls and desperate defending
- Eventually you get overrun
So, the Economy League tells us who controls the midfield of world power.
The Economic League carries the greatest weight (40%) in the League of Nations system. In today's world, economic heft creates the foundation upon which all other forms of influence rest.
- Enabler of everything else: Military capabilities require funding, cultural exports need commercial infrastructure, and even diplomatic influence often correlates with trade relationships. In essence, the economy is not merely one dimension of power—it is the foundation upon which all other dimensions depend funded by the economy.
- Predictive of staying power: Countries fall from power when economic engines stall even if armies look intact.
A nation’s economic power is not simply the size of its economy, nor its wealth per citizen, nor its innovation capacity alone. It is the interaction of these forces that determines the strength, agility, and endurance of a state in geopolitical competition. The five selected metrics work together to capture all three essential dimensions of economic power:
- Scale – the total resources a state can command
- Quality – the efficiency and productivity of its economy
- Future Capacity – its ability to adapt, innovate, and expand power over time
THE 2025 ECONOMICS LEAGUE
2025 Rankings:
- USA (539.04) - Tech dominance, dollar hegemony | +96% since 1991
- China (473.54) - Only 66 pts behind USA | +333% since 1991 ⚡
- EU (365.09) - Single market strength, structural cracks | +83%
- Germany (329.29) - Export machine, energy vulnerable | +50%
- UK (303.31) - Financial services, post-Brexit | +68%
- Japan (302.36) - Stagnation trap | +17% ⚠️
KEY INSIGHTS: ECONOMIC SMART POWER (1991-2025)


We've had three economic epochs:
- 1991-2001: American Unipolar Economic Dominance
- USA's tech boom (Microsoft, Intel, Amazon, Google)
- Japan's Lost Decades begin
- China joins WTO (2001) as "workshop of the world"
- 2001-2015: China's Economic Rise / Western Crisis
- 2008 Global Financial Crisis destroys Western economic legitimacy
- China's stimulus > Western austerity
- China overtakes major economies sequentially (Canada→Russia→Italy→UK→ France→Germany)
- 2015-2025: China-USA Economic Bipolarity
- China closes gap from 80 points (2015) → 66 points (2025)
- USA maintains edge through tech, shale energy, dollar hegemony
- COVID-19 (2020) tests state models: China's authoritarianism vs. US democracy
Economic Crossover Forecast (2025-2030):
- 2028: China's GDP likely overtakes USA in nominal terms (already ahead in PPP since 2014)
- 2030: Economic League gap: USA 609.95 vs. China 549.44 (60-point gap)
- Critical Juncture: If China maintains 6% growth and USA hits recession, crossover by 2028
Thucydides Economic Trap Warning:
When the economic challenger nears 90% of hegemon's GDP, historical probability of conflict rises to 75% (Graham Allison's Thucydides Trap research, 16 cases since 1500).
Current Status (2025): China at 88% of USA's economic score (473.54 / 539.04)
⚠️ THUCYDIDES DANGER ZONE REACHED
Critical Crossover: China overtakes USA 2028-2030 (current trajectory)
Key Events:
- 1997: USA > Japan (dot-com boom vs. Lost Decades)
- 2009: China > France (Global Financial Crisis vs. stimulus)
- 2014: UK > France (City of London resilience)
- 2018: China > UK (Belt & Road momentum)
HOW DO WE MEASURE ECONOMIC POWER?
In both football and economics, these metrics serve as critical indicators of a team’s—or a nation’s—current strength and future potential. Understanding how these elements interconnect is the key to crafting a winning strategy, whether in the League of Nations or the Champions League. The smart leader—or manager—knows where their strengths lie and anticipates where the opposition will attack.
These are the games we play:
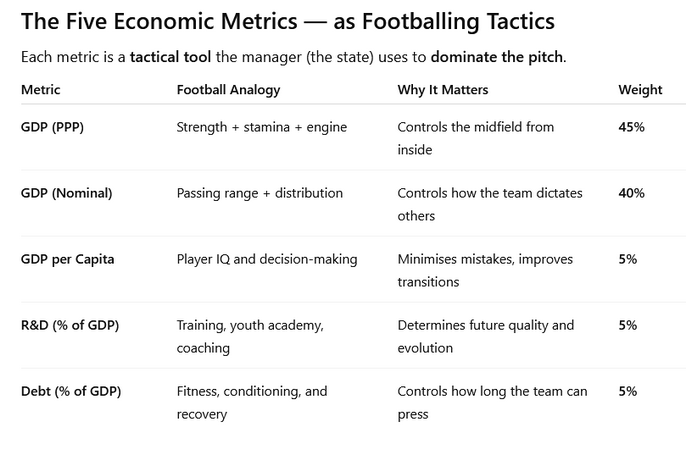
The weightings assigned reflect how heavily each dimension shapes a country’s real ability to project and sustain power.
Put simply:
- PPP wins the midfield battle
- Nominal GDP dictates the game
- GDP per capita ensures quality of play
- R&D keeps the squad evolving
- Debt management ensures the team can play the full season
This is how national power works on the world pitch.
Great powers don’t just attack well.
They dominate midfield.
They control the game.
They dictate the terms of play.
1. GDP PPP 45% 1991-2025
Captures: Real Strategic Capacity
The engine room. The player who never stops running.
This is your ball-winning, tempo-setting midfielder — think Rodri, Busquets, Xabi Alonso in his prime.
PPP tells you how strong your midfield “engine” really is — how much real play you can generate inside your own half.
If PPP is high:
You dictate the game.
If PPP is weak:
You get bullied off the ball.
Manager’s Tactical Instruction:
“Dominate the centre of the pitch. Build from strength. Control the rhythm.”
PPP measures the domestic purchasing power of a state—how much real infrastructure, manufacturing, energy, technology and mobilisable workforce capacity it can actually command. GDP PPP (45%), or purchasing power parity, adjusts for cost differences across economies, providing a more accurate comparison of actual living standards and economic size. By this measure, China has already surpassed the United States, with $31.5 trillion to America's $26.9 trillion, reflecting its enormous productive capacity despite lower price levels.
GDP by PPP reflects what a country can purchase with its GDP in its own economy, thus providing a clearer view of its economic influence and real domestic power capacity.
- It reflects a state’s internal industrial and mobilisation potential.
- It tells us how much real power the state can produce at home, not just what it appears to be worth abroad.
- In war, emergency mobilisation, or state-led transformation, PPP is the metric that matters.
Why it is weighted highest:
Because internal productive power is the true engine of strategy. Without it, the rest is theatre. Weighting rationale:
- Real command over resources: PPP captures what a state can actually buy and build at home—bases, roads, factories, rail—so it maps closely to real strategic capacity.
- Size + affordability: For mid-income giants, PPP reveals scale masked by cheap prices; it’s a better proxy for industrial and mobilisable capacity than nominal alone.
- Stability: PPP is less whipsawed by FX swings, making it a truer long-run base for power comparisons.
Smart Power Solution:
- Rebalance to Domestic Strength: The hegemon lifts real incomes and lowers input costs (energy, food, housing) to expand home-market demand and PPP heft, using supply-side investments (infrastructure, logistics, skills) to convert PPP into deployable power.
Source: IMF World Economic Outlook Database
2 GDP nominal 40% 1991-2025
Captures: External Influence and Market Power
Distribution and command of the pitch.
This is your player’s passing range — the ability to set the tempo outside your half and dictate play beyond your borders.
- Nominal GDP is how your team affects the opposition, sets prices, calls the tune.
- It determines whose currency is the ball.
If PPP is the engine, Nominal GDP is the playmaker’s vision.
Manager’s Tactical Instruction:
“Don’t just keep the ball — make them chase it. Set the game, don’t follow it.”
Nominal GDP measures value at market exchange rates, which is how the world prices trade, investment, and currency flows.
- It reflects a state’s ability to set rules, raise capital, price commodities, and influence global markets.
- States with large nominal GDPs issue reserve currencies, shape financial norms, and anchor global trade networks.
Why it is nearly as important as PPP:
Because economic power must be projected abroad to become geopolitical power.
PPP tells us what a state can do.
Nominal GDP tells us what it can make others do.
GDP nominal (40%) measures raw economic output at market exchange rates, favouring export powerhouses and financial centres. The United States still reigns supreme at $26.9 trillion, though China's $17.7 trillion demonstrates its meteoric rise.
A higher GDP generally means greater national wealth and resources, allowing for significant investments in infrastructure, defence, and other critical areas that reinforce national power.
GDP is the most direct measure of economic size, representing a country’s ability to generate wealth and allocate resources. Its weighting reflects both production capacity and the nation's financial capacity.
Weighting rationale:
- Global market clout: Nominal GDP, at market FX, tracks a state’s billing currency, capital-market depth, and import power—the bits that set rules and prices abroad.
- Hard-currency leverage: It proxies reserve-currency reach, deal-making ability, and sanction power.
- External projection: If PPP is the engine room, nominal is the shop window and the chequebook—vital for influence beyond borders.
Smart Power Solution:
- Anchor Currency & Markets: The hegemon defends price stability, deepens capital markets, and maintains open, rules-based trade and payments to keep its currency and bourses the world’s default venue—turning nominal scale into rule-setting power.
Source: IMF World Economic Outlook Database
3. GDP Per capita 5% 1991-2025
Captures: Economic Quality & Workforce Productivity
Player IQ, positioning, awareness.
High GDP per capita is the team that reads the game better.
- It’s decision speed.
- It’s coordinated movement.
- It’s the ability to play one-touch football under pressure.
It doesn’t win matches alone — but when the game gets tight, IQ tells.
Manager’s Tactical Instruction:
“Play smart, not just hard. Think faster than they do.”
This is the bridge from scale to resilience.
- High GDP per capita indicates strong institutions, high skills, a robust tax base, and social stability.
- It reflects the health of the productive population, not just the size of the economy.
Countries with high per-capita figures like Luxembourg ($133,590) demonstrate economic efficiency, even when smaller in absolute terms than giants like China ($12,720).
It highlights productivity and the standard of living. High GDP per capita suggests a wealthier and potentially more productive population, which can be a resilient workforce and consumer base.
GDP per capita indicates the standard of living and productivity of the population. It is crucial but secondary to the total GDP, as high productivity enhances national competitiveness.
Why only 5%:
A wealthy small state is not a great power. Productivity strengthens power, but cannot substitute for scale.
Weighting rationale:
- Productivity & resilience: High per-capita output signals human capital quality, management capability, and adaptive firms.
- Crisis absorption: Richer populations withstand shocks and fund the state without destroying growth.
- Secondary to scale: It refines, but doesn’t replace, the primacy of overall size—hence a modest weight.
Smart Power Solution:
- Diversify Economic Sectors: The hegemon broadens its productive base to lift productivity and living standards across regions and classes, hardening domestic legitimacy.
Source: IMF World Economic Outlook Database
4. R and D (% of GDP) 5% 1991-2025
Captures: Future Power & Innovation Trajectory
Youth academy + tactical evolution.
R&D is your coaching philosophy — whether your team evolves or gets left behind.
- AI? Biotech? New military platforms?
This is your training ground for tomorrow’s victory.
Teams that don’t innovate become predictable, and predictable teams lose.
Manager’s Tactical Instruction:
“Modernise the squad. Build for the next season — not just this one.”
R&D is the foresight metric.
- It predicts who will lead in next-generation industries: AI, robotics, biotech, advanced manufacturing, energy systems.
- It is the economic expression of national ambition.
Research and development expenditure as a percentage of GDP (5%) serves as a forward-looking indicator, measuring a country's investment in its future capabilities. This metric reveals not just current economic muscle but future potential.
Nations like South Korea and Israel, which devote over 4% of their GDP to R&D, are effectively purchasing future competitiveness and influence. By comparison, the global average hovers around 2.3%, with the United States at 3.5% and China steadily increasing its rate to nearly 2.4%. This metric reveals not just current economic muscle but future potential.
Innovation drives long-term economic growth and adaptability in a globalized economy. This metric is vital for sustained economic power and the ability to lead in emerging industries.
Why 5%:
Innovation determines future power, but it must be anchored in current scale to translate into influence.
Weighting rationale:
- Future power pipeline: A direct input into technology leadership, productivity waves, and military-dual-use spillovers.
- Lead indicators: Predicts who owns the next S-curve (AI, biotech, materials, energy).
- Scaled modestly: It’s catalytic, but without the mass of GDP it cannot translate to global weight—hence 5%.
Smart Power Solution:
- Increase Strategic Investments: The hegemon concentrates R&D on mission-critical platforms standards and innovation funding to maintain technological dominance. crowding-in private capital through procurement and prizes.
Source: World Bank World Development Indicators
5. General Government Gross Debt (% of GDP) 5% 1991-2025
Captures: Economic Freedom of Action
Fitness and match stamina.
Debt is how tired your team is in the final 20 minutes.
- Low debt = fresh legs for the run-in.
- High debt = heavy legs and forced substitutions.
A squad that can’t physically finish games eventually gets overrun.
Manager’s Tactical Instruction:
“Manage energy. Keep enough in the tank to press late.”
Debt levels determine strategic elasticity:
- Can a country stimulate, rearm, rebuild, or respond to crisis without destroying its economy?
- Low-debt states have room to manoeuvre.
- High-debt states must choose their priorities—and can be forced to retreat.
Government debt as a percentage of GDP (5%) indicates fiscal sustainability and future economic freedom of action. Japan's towering 263% ratio contrasts sharply with Russia's relatively modest 17%, though the figures alone don't tell the complete story of economic stability.
High debt levels can constrain economic growth and reduce financial flexibility, while low debt enhances a country's resilience in economic downturns. Economies with manageable debt have more options for economic expansion and crisis management.
This metric provides insight into financial stability and crisis resilience. While it is essential for long-term economic health, it’s weighted lower since it’s a risk indicator rather than a direct measure of economic power.
Why 5%:
Debt does not confer power — but it can remove it.
So it functions as a moderator rather than a driver of power.
Weighting rationale:
- Freedom of manoeuvre: Debt ratios bound a state’s fiscal agility in war, recession, or industrial policy.
- Risk filter, not size: It conditions power rather than defines it, so it deserves signal weight, not headline weight.
- Comparability over time: Long runs of debt data track policy credibility and macro discipline.
Smart Power Solution:
- Debt Restructuring: The hegemon lengthens duration, widens the home investor base, and ties issuance to growth assets—preserving fiscal firepower and shielding strategy from rate shocks and to prevent the challenger from gaining leverage.
IMF World Economic Outlook Database
Where Are You in the Economic Revolution of the Day?
As a manager, you must assess whether your team is at the top of its game or falling behind in tactics. In the economic revolution of our time, are we leading innovation, shaping trade networks, and dictating the play, or are we chasing the ball, letting challengers take control? Success here depends on whether you are the playmaker driving the game forward or merely reacting to the opposition’s moves. If you’re not leading the economic revolution, you risk losing the midfield battle—and with it, the match.
Where Are You in the Economic Cycle of the Day?
Every great team has its seasons. Are you enjoying a golden run, where resources are abundant, and influence grows, or are you facing a period of overreach, where cracks begin to show? Just as a football team risks burnout by pushing players too hard, an economy risks decline through unsustainable spending, over-reliance on fragile supply chains, or neglecting emerging threats. Mismanaging the cycle leaves you open to exploitation—your rivals will press high, forcing mistakes and capitalizing on your errors. A clear-eyed understanding of the cycle is essential to avoid this tactical collapse.
What Hybrid Economic Wars Are Challengers Setting as Traps for You?
Your challengers are not playing a fair game. They’re employing what we call smart wars—hybrid economic strategies designed to undermine your position without direct confrontation. Imagine these as tactical fouls designed to break your rhythm:
- Economic Isolation: Rivals block your access to key trade networks, starving your midfield of the ball.
- Currency Competition: They launch a competing currency, like an opposition playmaker disrupting your structure.
- Debt Diplomacy: Rivals loan heavily to your allies, buying them out like a club snatching your best players.
- Resource Control: They monopolize critical raw materials, ensuring you lose vital supply lines.
- Strategic Investments: They quietly infiltrate your system, acquiring influence and control—akin to poaching your assistant coaches.
These traps are not random—they’re part of a calculated strategy to dismantle your team from the inside out.
What Is the Smart Power Solution?
To counter these traps, you must deploy economic smart power, a proactive, strategic approach that turns defence into attack. Winning this game requires three key plays:
First, dominate the revolution. Lead innovation, enhance productivity, and control global trade networks. This is how you dictate the tempo, ensuring the game is played on your terms.
Second, balance the cycle. Avoid overreach by investing wisely and diversifying your dependencies. Like rotating players to avoid fatigue, a resilient economy ensures you remain strong and adaptable, even under pressure.
Finally, counter the hybrid wars. Neutralize isolation by expanding alliances, strengthen your currency through financial innovation, and use strategic investments to outflank your rivals. These are not reactive measures but calculated plays designed to regain control and outmaneuver challengers.
Conclusion
Economic power is the foundation of all other power, just as midfield dominance is the key to winning football matches. It fuels your defence, supports your attack, and sustains your team’s confidence. To lead effectively, you must know your position in the economic revolution, anticipate the traps set by challengers, and deploy smart power to out-think and outplay them. Without economic power, you’re not managing a team—you’re managing an illusion. With it, you can build a dynasty.