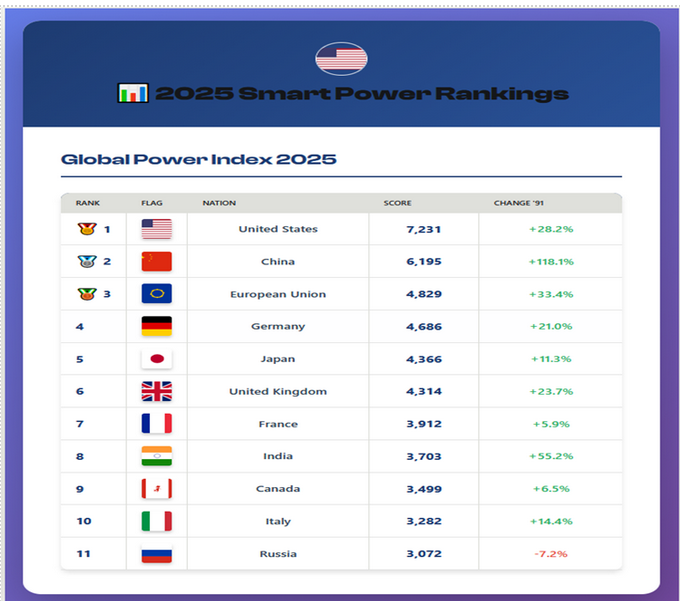
So, you've seen how the top countries are performing in the overall League of Nations 2025. The 7 power leagues combined.
Look at the chart here. Can you see the 6 amazing events have shaped the world we live in since the collapse of the USSR? Over 35 years once mighty teams have tumbled and minnows now threaten the old order. The story of our time has been the amazing rise of China and India and the slow slide of Japan and France. Britain, despite Brexit, has muddled through.
Who's winning? Who's losing? When were the great crossover years?
These were the big moments when teams on the rise overtook teams in decline.
The big dramas that nobody knew about. When the world changed in front of our eyes:
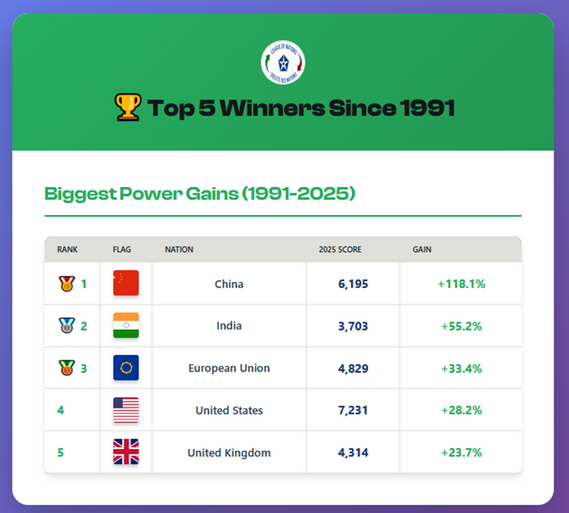
- The rise of China: from 10th to 2nd in 20 years. You see big crossovers in 2005 and 2014
- The rise of Europe: from 5th to 2nd in 15 years, with crossovers in 1995 and 2009 before sliding to 3rd after Brexit
- The rise of India: from 11th to 8th in 10 years, crossing over in 2015 and 2023
But their rise, meant others suffered. This era saw:
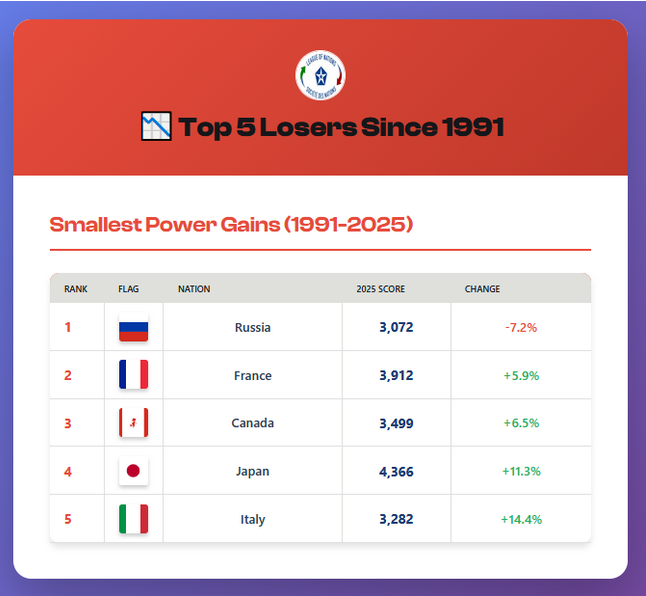
- The fall of Japan: from 2nd to 5th in 15 years slipping in 2009
- The fall of France: from 4th to 7th in 30 years sliding in 1995, 2005 and 2013
- The fall of Russia: from 7th to 11th in 30 years after 2022
We're going to find out why.
The 2025 standings confirm what the data has been telegraphing for a decade:
China is closing the gap on the USA.
Like the US and Germany closed the gap on Britain in the 20th century.
Like Britain closed the gap on France in the 18th century
Like the French closed the gap on the Habsburgs in the 16th century.
Let’s see the closing gap.
- In 1991, America led China by 2,801 points—a margin so vast it seemed insurmountable, akin to a 50-point Premier League lead.
- By 2025, that gap has shrunk to 1,036 points.
- China's average annual gain? +98 points per season (1991-2025).
What's happened?
IT’S THE ECONOMY, STUPID
You know how the top teams are positioned overall.
Now we’re going to dig deeper to find out why. Week by week, we'll investigate how each country has performed in each league.
The first and biggest league is the Economic League. It carries the greatest weight (40%) in the League of Nations system. In today's world, economic heft creates the foundation upon which all other forms of influence rest.
Since the Berlin Wall fell in 1989, we've witnessed the greatest redistribution of economic power in 500 years. The league table has been rewritten. Champions have been relegated. Underdogs have stormed to the top. This is the story of who's winning the future—and who's being left behind.
Let’s track how they’ve risen and fallen over the years. Click replay, see scores and ranks, stop by clicking on a year.
So, the Economy League tells us who controls the midfield of world power.
Who’s winning?
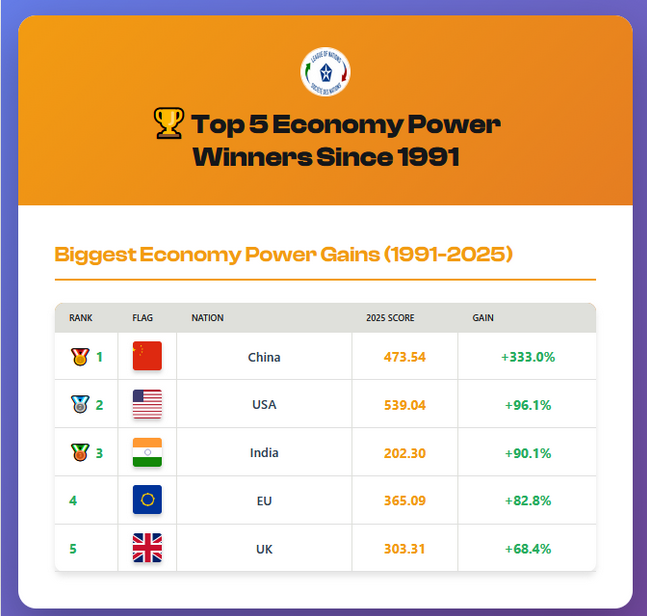
Here’s the percentage growth each top economy has added since 1991.
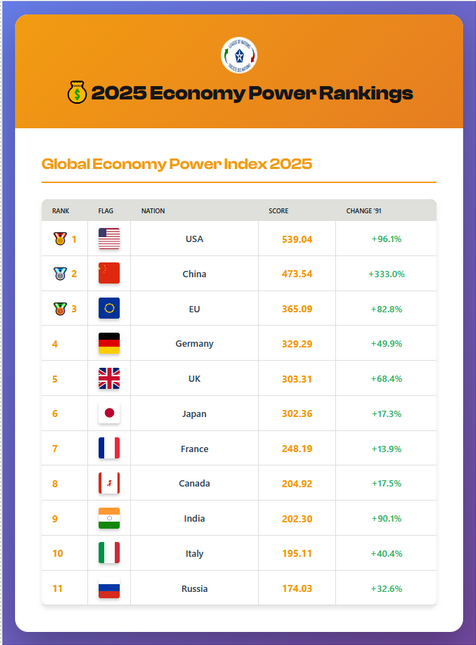
In short.......
- USA (539.04) - Tech dominance, dollar hegemony | +96% since 1991
- China (473.54) - Only 66 pts behind USA | +333% since 1991 ⚡
- EU (365.09) - Single market strength, structural cracks | +83%
- Germany (329.29) - Export machine, energy vulnerable | +50%
- UK (303.31) - Financial services, post-Brexit | +68%
Who’s losing?

The economies of France, Japan and Canada have staggered hopelessly since the end of the Cold War.
Why?
Questions:
- What economic levers has China pulled to rise so quickly?
- When will China overtake the US?
- How did the US stay ahead?
- Has India copied China?
- Why has the UK risen even after Brexit?
- Why have France, Japan and Canada tanked?
To answer we must dig deeper.
HOW DO WE MEASURE ECONOMIC POWER?
A nation’s economic power is measured by these five selected metrics or games in the economic league. They work together to capture all the essential dimensions of economic power. These are the games we play and their weightings in the Economy League:
- GDP Nominal 45%
- GDP PPP 35%
- GDP Per Capita 10%
- R&D 5%
- Debt 5%
Like Total Football—where every player must work in concert—these five metrics interact to show economic power. Hegemons need overwhelming scale (45% + 35% = 80%) to dominate, but they maintain dominance through quality and innovation (15%), and they fall when debt undermines their foundations (5% warning).
- Scale × Resilience: GDP Nominal (45%) provides global reach; GDP PPP (35%) provides domestic staying power. Together they account for 80% of your score because they define your capacity to sustain power projection over time.
- Quality × Innovation: GDP Per Capita (10%) × R&D (5%) = 15% for human capital and technological edge. These are your agility factors—they determine how quickly you adapt to new rules and revolutions.
- Vulnerability Check: Debt (5%) is your reality check. It prevents hubris. A country scoring high on the first four metrics but drowning in debt (like Japan or potentially the US) faces constraints that pure economic size obscures.
The weighting system mirrors how power actually works in history.
Understanding how these elements interconnect is the key to crafting a winning strategy in the League of Nations. The smart leader knows where their strengths lie and anticipates where the opposition will attack.
So what are the headlines that explain why:
- The US has kept its lead
- China and India have raced away.
- The UK and Germany are treading water.
- France, Japan and Canada are in the relegation zone.
So let’s see how our top table have used smart power to balance scale, quality and vulnerability in the economy league. Like football teams they will have played to a format.
The Verdict: unequal winners, sliding losers.....
The four winners occupy different tiers. The United States is the champion. China is the challenger. The European Union is the disciplined technocrat: it excels in regulatory power and fiscal sustainability but lacks the scale or strategic coherence to challenge for the top. India is the dark horse: it climbs the table through demography and growth momentum.
• USA: 539.04 (the champion)
• China: 473.54 (88% of USA)
• EU: 365.09 (68% of USA)
• India: 202.30 (38% of USA)
These four have mastered different dimensions of the Smart Power formula—Scale × Quality × Discipline—and arrived at dominance through radically different strategies.
By 2035, the race will tighten: America is projected at $30.8 trillion, China at $28.3 trillion, India at $6.1 trillion. But the pecking order will likely hold. The United States retains the crown because it mastered the formula: Scale × Quality × Discipline. China challenges because it mobilised scale. India rises because it has demography. The EU survives because it has discipline.
The flip side of the Economy League is the story of decline—not collapse, but a slow-motion eclipse. The four losers—United Kingdom, France, Germany, and Japan—are advanced economies with wealthy populations, world-class universities, and centuries of accumulated capital. They are not failed states. They are fading champions: clubs with glorious pasts, trophy cabinets full of European Cups, but now struggling to avoid relegation from the Premier League.
Their composite Smart Power scores tell the story of structural stagnation:
• Germany: 329.29 (best of the losers, but demographic doom looms)
• UK: 303.31 (Brexit self-harm)
• Japan: 302.36 (debt catastrophe, 34-year deflation trap)
• France: 248.19 (lowest composite, slowest growth)
Why?
The Metric Scorecard: Who Wins What, Who Fails What
The answers reveal not just who won, but how they won—and whether their victories are sustainable. The five metrics paint divergent portraits of power and decline:
GAME 1. GDP NOMINAL (45%) – THE HEAVYWEIGHT CHAMPION : USA leads ($23.4T), China second ($19.4T). Among losers, Japan largest ($4.7T) but stagnant since 1991. India overtook UK (2023), France (2018), and will overtake Germany (2026) and Japan (2027).
Why it matters: This is your absolute firepower in the global arena. GDP Nominal measures your economy at current market exchange rates—the actual purchasing power you wield when buying weapons, funding alliances, financing infrastructure projects abroad, or simply imposing your will through economic sanctions.
France is genteel decline: high quality of life, low dynamism, perpetual fiscal deficits. France is Arsenal under Wenger—beautiful football, world-class talent, but consistently finishing below par because it cannot compete financially with oil-rich clubs.
Why the 45% weighting: Because in geopolitics, raw size matters most. When America wants to fund a military operation, bail out an ally, or sanction an adversary, it deploys dollars valued at current exchange rates. When China finances Belt and Road infrastructure, it writes checks in nominal terms. This metric captures what you can actually do on the world stage—your capacity to project power, absorb shocks, and sustain long-term competition.
The Smart Power logic: A large nominal GDP gives you optionality—the freedom to choose between guns and butter, between hard and soft power, between offense and defence. It's the foundation of grand strategy. Without scale, you're playing checkers while your rivals play chess.
GAME 2. GDP PPP (35%) – THE ENDURANCE FIGHTER: China dominates ($38.2T), reflecting vast population and lower costs. USA second ($29.2T). Japan leads losers ($6.4T), but PPP advantage reflects deflation, not vitality.
Why it matters: Purchasing Power Parity adjusts for cost differences between countries. It reveals your economy's internal strength—what you can produce and consume domestically without relying on global markets. This is your economic resilience, your ability to sustain yourself in isolation if necessary.
Germany is tragic: it did everything right—invested in education, maintained fiscal discipline, built world-class industries—but cannot escape the iron logic of demography. An economy of 84 million people, median age 47, cannot compete with billion-person markets. Germany is Bayern Munich in transition: still the Bundesliga champion, but aging, predictable, and vulnerable to younger, faster teams.
Why the 35% weighting: Because wars are won by endurance, not just flash. PPP measures your capacity to mobilise domestic resources—to feed your population, manufacture goods, build infrastructure, and maintain military readiness even when cut off from global supply chains. China's PPP-adjusted economy surpassed America's in 2016, signaling it could outlast the US in a protracted economic or military conflict fought on Asian terrain.
The Smart Power logic: In historical cycles of hegemonic transition, rising challengers often have massive PPP advantages before they achieve nominal dominance (think of Soviet industrialisation or Japan's post-war boom). PPP predicts future potential—it shows who has the domestic muscle to sustain a long campaign. When the cycle turns and the old order crumbles, the nation with superior PPP endurance often emerges victorious.
GAME 3. GDP PER CAPITA (10%) – THE QUALITY OF YOUR SQUAD: USA obliterates competition ($85,810), six times China ($13,303), thirty times India ($2,697). Among losers, Germany leads ($55,800) but cannot escape demography. Japan stagnant at $32,476 since 1995.
Why it matters: This measures the average prosperity of your citizens—the quality of your "players." Wealthy populations are better educated, healthier, more innovative, and more politically stable. They generate tax revenue, provide skilled labour, and sustain the social contract that prevents internal collapse.
The United Kingdom is self-inflicted: Brexit severed access to European supply chains and labour markets, accelerating decline. Britain is Nottingham Forest—two European Cups in the cabinet, but now struggling to avoid relegation from the Premier League. The fundamentals are no longer there.
Why the 10% weighting: Because quality multiplies quantity. A nation of prosperous, educated citizens punches above its weight in innovation, military effectiveness, and soft power. But per capita wealth alone doesn't win wars—tiny Luxembourg has among the highest GDP per capita in the world, yet wields minimal geopolitical influence. You need both scale and quality, but scale matters more for power projection. Hence 10%, not 5%, but not 35% either.
The Smart Power logic: Per capita GDP is your agility metric. Wealthy societies adapt faster to technological revolutions, recover quicker from crises, and attract global talent. They're also more resilient to populist upheaval. But history shows that large, poorer nations (China, India) can leverage sheer mass to overcome per capita deficits—at least in the short to medium term.
GAME 4. R&D SPENDING (5%) – THE INNOVATION ENGINE: USA leads (3.6%, $848B annually), defining 21st century tech (AI, semiconductors, biotech). China second (2.5%, $489B), leading applied tech (EVs, batteries). Japan spends 3.3% ($153B) but lost every tech revolution.
Why it matters: Research & Development is your investment in the future. It determines who leads the next technological revolution—AI, quantum computing, biotech, green energy. The nation that dominates R&D sets the rules of the next era, from technical standards to military capabilities to economic paradigms.
Why the 5% weighting: Because R&D is a force multiplier, not a standalone power source. America's R&D spending helped it dominate the post-1945 order through nuclear weapons, semiconductors, the internet, and biotech. But R&D alone doesn't guarantee victory—the Soviet Union invested heavily in R&D yet lost the Cold War due to systemic inefficiencies. R&D must be coupled with scale (GDP Nominal), resilience (GDP PPP), and human capital (GDP per Capita) to translate into actual power.
The Smart Power logic: In your framework of historical cycles, R&D reveals which nations are leading the revolutions (Rule 3). The hegemon that leads technological revolutions extends its dominance; the hegemon that falls behind accelerates its decline. At 5%, this metric acknowledges R&D's strategic importance without overstating its immediate impact on the balance of power.
GAME 5. GOVERNMENT DEBT (5%) – THE VULNERABILITY GAUGE : EU best (65%), Germany among losers (63%). USA constrained (125%), China weakening (94%, 280% total). Japan catastrophic (258%)—debt collapses the multiplier.
Why it matters: Debt measures your fiscal sustainability—whether you're living beyond your means. High debt constrains your freedom of action: you can't fund massive stimulus packages, military buildups, or geopolitical adventures without risking fiscal crisis. Debt is your strategic liability.
The four losers occupy different circles of economic hell. Japan is in the deepest: a once-great power locked in a 34-year deflationary spiral, burdened by 257% debt, and unable to reverse demographic collapse. Japan is AC Milan in the 2010s—seven European Cups in the cabinet, but now playing in mid-table mediocrity, unable to attract talent, and one bad season away from administration.
Why the 5% weighting: Because debt is a double-edged sword. Moderate debt can signal strength (markets trust you to repay), but excessive debt signals fragility. Japan's debt-to-GDP ratio exceeds 250%, yet it remains stable; Argentina defaults repeatedly at far lower ratios. Context matters. At 5%, this metric serves as a warning indicator—a red flag that tempers your overall power assessment. It prevents countries from appearing stronger than they are by borrowing from the future.
The Smart Power logic: In cycles of hegemonic decline, debt often precedes collapse (see Spain in the 17th century, Britain post-WWI, potentially America today). Debt limits your ability to crush your rivals (Rule 5) or buck the cycle (Rule 6) because creditors constrain your choices. But debt isn't destiny—smart leaders can manage it through growth, inflation, or restructuring. Hence 5%: important enough to matter, but not determinative.

The gap between winners and losers is decisive. USA's composite score (539) exceeds Japan's by 78%. China's score (474) exceeds Germany's best-of-losers (329) by 44%.
The Economy League is unforgiving. The winners—USA, China, India—control scale and dominate the table. The losers—UK, France, Germany, Japan—lack scale and fade from the top tier. The multiplier effect is brutal: moderate scale × moderate quality × moderate discipline = moderate power. It rewards balance and punishes fatal weaknesses. And in a world dominated by continental economies, moderate power is irrelevance.
Let us judge each country against the Seven Smart Power Rules.
The Seven Smart Power Rules: Winners vs Losers

The Smart Power Rules are not guarantees, but they are preconditions. A country that plans for the long term, leads the league, masters the next revolution, deploys all seven powers, crushes rivals, bucks the cycle, and writes the rules will dominate. A country that ignores these rules will fade, no matter how wealthy it once was. The game is on, the table is set, and the verdict is clear: in the Economy League, the United States remains the best winner. For now.
Rule 1: Best Plan vs Worst Plan
China wins: 17x GDP growth (1991-2025) from $1.1T to $19.4T at 8.7% CAGR—forty years of unbroken strategy (SEZs, WTO, Belt & Road, Made in China 2025). USA muddled through (2.4x growth, 2.6% CAGR) but retained tech edge through decentralised innovation. Japan loses worst: 1.3x growth (0.7% CAGR) over 34 years—asset bubble, zombie banks, deflation trap, 30 PMs with zero credible strategy. UK lurched from deindustrialisation to Brexit with no long-term plan.
BEST: China | WORST: Japan
Rule 2: Best Leader vs Worst Leader
USA wins: created post-1945 order (Bretton Woods, dollar reserve currency 60%, IMF, WTO, SWIFT, GPS). China challenges (Belt & Road, AIIB) but RMB only 5% of reserves. Japan loses worst: no UN veto, no nukes, pacifist constitution, US-dependent—zero rule-writing capacity. Germany is political dwarf despite economic heft. UK retains UN veto but post-Brexit isolation weakened influence.
BEST: USA | WORST: Japan
Rule 3: Best Economy vs Worst Economy
USA wins (539): optimal balance—massive scale ($23.4T nominal, $29.2T PPP), exceptional quality ($85,810 per capita, 3.6% R&D), manageable discipline (125% debt sustainable via dollar dominance). No fatal weakness. Japan loses worst (302): moderate scale × moderate quality × catastrophic discipline (258% debt) = collapsed multiplier. Debt is silent assassin. France lowest composite (248)—weak on all dimensions.
BEST: USA | WORST: Japan
Rule 4: Best Revolution vs Worst Revolution
USA wins: leads 21st century tech (AI, semiconductors, biotech, cloud). $848B annual R&D, 60% global tech market cap, half of world's top-cited research. China leads applied tech (EVs, solar, batteries) but lags foundational research. Japan loses worst: spent 3.3% GDP on R&D for 30 years ($153B annually), lost leadership in every revolution—semiconductors (TSMC/Samsung), electronics (Apple/Samsung), EVs (Tesla/BYD). Structural failure: risk-averse culture, lifetime employment. UK sold crown jewels (DeepMind, ARM).
BEST: USA | WORST: Japan
Rule 5: Best at Rivals vs Worst at Rivals
USA wins: contained USSR (1947-1991), now slowing China via CHIPS Act, AUKUS, trade wars. China's growth slowed from 10% to 5-6%. Germany loses worst: Nord Stream 2 locked Russia energy dependence; auto exports collapsed as China shifted domestic. Built export model on two pillars (cheap Russian gas, Chinese demand)—both crumbled. Cannot pivot due to legacy tech lock-in. UK's Brexit was self-sabotage.
BEST: USA | WORST: Germany
Rule 6: Best Bucking Cycle vs Worst Bucking Cycle
China wins: 2008 $586B stimulus (12% GDP) turned crisis into infrastructure bonanza; 2020 exited COVID first, captured export share. USA also strong (2008 TARP/QE, 2020 $5T stimulus) but at debt cost. Japan loses worst: 34-year deflation trap—crisis IS the cycle. Cannot stimulate (aging consumers), cannot cut debt (structural deficits), cannot inflate (deflation persists). Bank of Japan owns 50% of bonds, trapped. UK's 2010-2016 austerity deepened recession.
BEST: China | WORST: Japan
Rule 7: Best Winner vs Worst Loser
USA wins (539): highest composite, dominates scale + quality + discipline. Not largest PPP (China), not fastest-growing (India), not lowest debt (EU)—but no fatal weakness. Japan loses worst: GDP grew 23% over 30 years (1995-2025), per-capita income flat since 1995, debt exploded 80% to 258%, population shrinking 500,000/year. Terminal decline—cannot reverse demography, cannot inflate debt, cannot escape trap. UK's Brexit self-inflicted but reversible. Germany retains discipline but demography dooms. France chose welfare over dynamism.
BEST: USA | WORST: Japan
Economic Power League: The Verdict - Scale Is Destiny

The lesson for the losers is sobering: quality and discipline are not enough. Without scale, you are forever playing catch-up against teams that can field eleven substitutes and still win. Japan commits all seven sins: worst plan, worst leader, worst metric use, worst revolution lead, worst at bucking the cycle, worst loser. Germany commits three: strategic paralysis (Russia/China dependence), missing tech revolutions (EVs, software), demographic doom. The UK commits two: strategic incoherence (Brexit), crisis mismanagement (austerity). France commits one: lowest composite score, slowest growth.
The Seven Smart Power Rules separate champions from losers decisively.
- USA dominates five rules (Leader, Economy, Revolution, Rivals, Best Winner), scoring 539—14% ahead of China.
- China wins two (Plan, Bucking Cycle), scoring 474 through massive scale compensating for quality gaps.
- EU scores 365 via regulatory power and fiscal discipline but lacks scale. India scores 202—demographic momentum dragged down by quality deficit (per-capita $2,697, R&D 0.6%).
But the losers fare worse:
- Japan fails worst in six rules (Plan, Leader, Economy, Revolution, Bucking Cycle, Worst Loser). Its 258% debt collapses the multiplier: moderate scale × moderate quality × near-zero discipline = composite 302.
- Germany scores 329 (best of losers) but commits worst sin on Rivals—Russia/China dependence became strategic paralysis.
- UK scores 303, committing multiple sins: Brexit incoherence, sold crown jewels (DeepMind/ARM), austerity mistake. But UK shares fatal flaw with all losers: insufficient scale. An island of 68 million cannot compete with billion-person markets.
- France scores 248 (lowest composite)—welfare over dynamism, perpetual deficits, 1.7x growth over 34 years.
The multiplier effect is brutal: moderate scale × moderate quality × moderate discipline = moderate power = irrelevance. Winners control scale—USA $23.4T nominal, China $19.4T, India $3.7T overtaking all European powers.
Losers lack scale—Germany $3.7T capped by 84 million aging population, UK $3.4T eclipsed by India 2023, Japan $4.7T stagnant since 1991, France $2.8T slowest growth.
Scale determines ceiling. Quality (per-capita income, R&D) is the multiplier. Discipline (debt) is the constraint.
- USA masters all three.
- China dominates scale, rising quality, weakening discipline.
- India has scale momentum, quality deficit.
- Japan has catastrophic discipline (258% debt), moderate scale/quality—product collapses.
By 2035, USA projects $30.8T, China $28.3T (gap narrows to 9%), India $6.1T (overtakes Japan decisively).
Losers project:
- Germany $4.1T (demographic collapse continues)
- UK $4.5T (Brexit drag persists)
- Japan $5.2T (stagnation locked in)
- France $3.5T (slowest trajectory).
The pecking order holds: USA retains crown, China closes gap, EU holds third, India climbs fast. Among losers, Japan is worst—no redemption path. Germany is tragic—did everything right but cannot escape demography. UK is self-inflicted—Brexit severed fundamentals. France chose comfort over dynamism.
The verdict is final: in the Economy League, scale is destiny, quality is the multiplier, discipline is the constraint. A country that plans long-term, leads the league, masters revolutions, deploys all powers, crushes rivals, bucks cycles, and writes rules will dominate. A country that ignores these rules will fade, no matter how wealthy it once was. The United States remains the best winner. Japan is the worst loser. The game is on, and the table does not lie.