
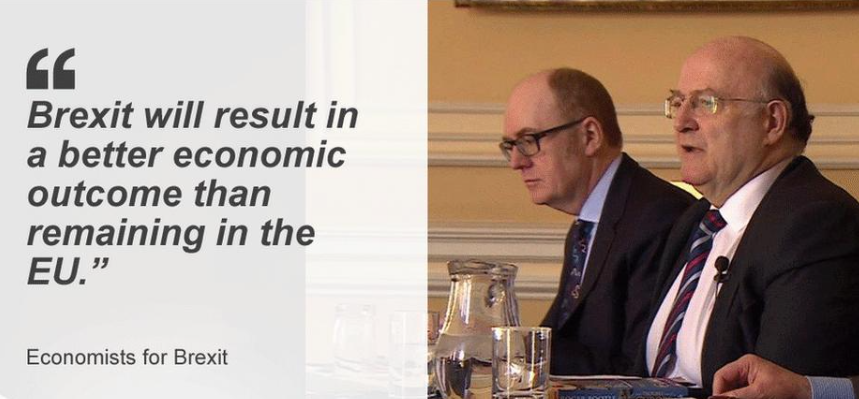
No. Brexit was sold as an economic liberation: more control, faster growth, stronger investment, higher productivity, and a richer Britain. But when the five match reports are read together and then carried through to 2030, the verdict turns decisively against Britain. All point to the same result: Britain did not turn Brexit into a stronger economic machine than the European system it left.
See how the UK fares not just against the top five, but across Europe, in the League of Nations dashboard.
The Problem
The problem is a weaker economic system showing up across the whole league. Britain did not collapse. It drifted. That is what makes the story dangerous. A country can remain respectable for years while still losing the season. Britain rebounded after the 2020 shock, but the recovery never became a real breakaway. The forecast shows the UK staying just ahead of the EU through 2027, then losing that edge by 2028 and finishing 2030 behind.
Why?
The 5 Reasons
1) Growth — the promised breakout never arrived
The growth match remains the cleanest rebuttal to the original Brexit promise. As the growth brief shows, this is where you find out whether the whole machine is working. Britain was supposed to outgrow Europe once free of Brussels. Instead, average growth fell from 2.44% to 1.29%, and Britain finished behind the bloc it left. On the League of Nations forecast, Britain is not just slowing. It is underperforming the EU all the way to the end of the decade.
2) Capital — the investment premium became an investment wait
If growth was the promise, capital was supposed to be the fuel. Yet the capital brief shows that Brexit did not produce an investment boom or a deregulated British renaissance. It produced hesitation. The UK stayed below the EU in gross capital formation every year, and investment was reduced by 12% to 18%, in line with broader evidence from the NBER and EconoFact.
Investment is where future productivity, future growth and future competitiveness are quietly decided. A country that cannot get capital committed on time pays later, when its rivals have already built the next factory. The forecast? Britain remains below the EU through 2030, while stronger sovereign comparators such as Italy stay further ahead.
3) GDP per capita — the prosperity line flipped the wrong way
The richest political claim of Brexit was that Britain would end up better off. The spending-power brief says the opposite. In 2012 the UK was ahead of the EU on GDP per capita PPP, at $47,551 against $46,546.7. By 2024 the line had reversed: Britain built a weaker prosperity machine.
Growth and capital can sound abstract. Income per person cannot. If Britain is producing less prosperity per head than the benchmark it once expected to beat, the promise of economic liberation starts to look like a story of diminished returns. Britain does not close the gap by 2030. It remains below the EU and drifts further behind in spending power per person.
4) Reserves — sovereignty produced a buffer, not a winning shield
The reserves match matters because Brexit promised resilience as well as freedom. Britain’s reserves did rise over the period, and the reserves brief shows that the UK sits above the EU. But that is only the easy comparison. Britain still looks second-tier beside Germany, France and Italy, all of which built much larger sovereign reserve cushions. The British shield exists. It just does not dominate the match.
5) Productivity — friction beat freedom
Productivity is the gearbox. The productivity brief shows Britain’s post-Brexit freedom stalled. The UK moved from above the EU to below it, while the Office for Budget Responsibility estimates a long-run productivity hit of 4% relative to staying in the EU. Wages flatten, investment has less reason to arrive, and growth loses force: Britain remains almost flat to 2030 while the EU keeps climbing away. Not a crash. Immobilisation.
Final Whistle: UK mid-table stagnation
Put the five reasons together and the scoreline is clear. Taken alongside the OBR, the latest NBER research, and EconoFact’s summary, the 2030 chart looks exactly as it should: flatter for Britain, firmer for Europe, and ending with the EU ahead. Growth is weaker. Capital formation is weaker. Prosperity relative to the EU is weaker. Comparative resilience is weaker in the wider European field. Productivity is barely moving while Europe keeps climbing.
If nothing changes, the likeliest story of the late 2020s is not collapse but relegation by drift: a respectable side, still in the division, but losing too many matches to stay in the top flight.
2. So what do we do?
Target: lift Britain from 5th back to 3rd by 2030.
The Problem
Britain’s problem is no longer diagnostic. We know where the points were dropped. Growth weakened, capital formation underperformed, productivity stalled, and the promised rise in household prosperity turned out to be less a victory parade than a false dawn. The question is no longer what went wrong. It is whether Britain treats this as a bad patch or a bad system, as both the Office for Budget Responsibility and the Bank of England increasingly suggest.
Countries do not escape this sort of drift through better slogans. They do it by changing the machinery underneath the numbers. Not a team talk, in other words, but a change of shape, as the OECD’s UK competitiveness review makes plain.
The Precedent
India in 1991 offers one reminder. Faced with weak growth, heavy controls and what the Cato Institute called “empty foreign exchange reserves”, P.V. Narasimha Rao loosened controls, cut licensing and opened the economy more fully to competition and investment. Britain is not India in 1991. But the lesson travels: when the system is throttling output, serious governments change the rules.
Germany offers another. Faced with weak growth and high unemployment, Gerhard Schröder pushed through Agenda 2010: labour-market and welfare reforms designed to raise participation, sharpen incentives and improve competitiveness. The politics were ugly. Serious repair usually is.
The Lesson
Britain’s equivalent means reducing trade friction where it matters most, restoring planning and infrastructure credibility, rewarding investment rather than merely announcing it, and treating productivity as the main route back to higher wages rather than as a happy accident. Much of that repair is structural rather than fiscal. The government’s Planning and Infrastructure Bill guide, the OBR’s planning reform analysis, and the OECD all point in the same direction: planning reform and grid reform are mainly about changing the operating environment, not simply spending more.
Britain does not need nostalgia. It needs a comeback plan.
3. So how much will it cost?
The verified long-run economic drag from Brexit is about £100bn a year on the OBR’s central assumption, because the UK economy is projected to be roughly 4% smaller than it would otherwise have been. That is the scoreline.
Under the current Brexit settlement, a serious repair effort costs around £15–35bn a year in extra public support, with the rest coming through legislation, regulation, guarantees, tax design and private investment rather than old-fashioned spending alone. That is consistent with the evidence from the Bank of England and the OECD.
Broken down by match, the repair job looks like this.
- Growth needs faster planning, grid and transport delivery: roughly £2–5bn a year, mostly to support delivery rather than fund a giant national splurge, as implied by the Planning and Infrastructure Bill and the OBR’s planning work.
- Capital needs stronger allowances, scale-up finance and more certainty, with support channels also running through institutions such as UK Export Finance: roughly £3–8bn.
- Personal wealth needs childcare, skills and labour-force support so more people can work, train and earn: roughly £5–10bn, broadly consistent with the evidence from Reuters’ childcare reporting, the Institute for Fiscal Studies, and the OECD.
- Reserves and resilience need a stronger export base and more reliable external earning power: roughly £1–4bn.
- Productivity needs innovation diffusion, technical adoption and training: roughly £4–8bn, building on the wider public R&D base tracked by the ONS. Add it up and the direct public repair bill lands at £15–35bn.
But that bill is not fixed. It depends on how much friction Britain chooses to keep playing with.
What if we were back in....?
A customs union would ease goods friction, especially in the growth, capital and resilience matches. But it would do much less for services and would not fix Britain’s own failings in planning, skills or productivity. So it could cut the repair bill to roughly £12–28bn a year, a reduction of about £3–7bn against the current settlement, as suggested by UK in a Changing Europe and the House of Commons Library.
A single-market arrangement would go further. By lowering a broader set of trade frictions, it would help across growth, capital, personal wealth and productivity. The House of Lords Library cites gains from a limited reset and larger gains from deeper alignment. But only part of that should count as a lower public repair bill, because Britain would still need domestic reform. A cautious estimate is a reduced repair bill of around £10–23bn a year, a reduction of about £5–12bn.
Rejoining the EU would reduce the bill furthest, though not to zero. It would remove more of the trade and productivity penalty than either partial option. But it would not abolish Britain’s non-Brexit weaknesses in planning, housing, skills or capital allocation. So even here, the result is not rescue from the transfer window. It is a smaller repair job: roughly £7–20bn a year, implying a reduction of £8–15bn against the current settlement, judged against the OBR, UK in a Changing Europe, and the House of Lords Library.
Final Whistle
Economic power: cost of league recovery
| Current Brexit deal | Lower-friction EU option | Why |
|---|---|---|
| £15–35bn/yr | £7–28bn/yr | Closer EU alignment lowers the repair bill, but does not remove Britain’s home-grown structural problems |
So the bill is real, but it is not fixed. Under the current deal, the direct public repair bill is around £15–35bn a year. A customs union could cut that to £12–28bn. A single-market-style arrangement could cut it to £10–23bn. Rejoining the EU could cut it to £7–20bn. None of those options removes the need for domestic reform. But the closer Britain moves towards lower-friction European trade, the smaller the repair job becomes — exactly the message of the OBR baseline and the OECD.
Smart Power Summary
Put together, the verdict is bleak but not fatal. The Economic League's 5 matches show Britain did not use Brexit to build a stronger economic machine than the Europe it left: growth slowed, capital hesitated, productivity stalled and prosperity per head slipped. The lessons from India and Germany show drift is reversible, but only if Britain changes the rules, not the rhetoric. The repair bill is costly, though cheaper than drift, and cheaper still with lower-friction European trade. Smart power means admitting the model failed, fixing it at home, and reducing the barriers that keep Britain stuck mid-table.
The Power Brief gives you the match. The Situation Report gives you the season — the full table, the future trend, and the leaders who found a way back.
Inside the SitRep:
- Britain’s final place in the composite Economic league
- the 2030 forecast
- the full 30-country comparison
- the leaders who used Smart Power to escape the same trap
If you want to stop guessing and start seeing where Britain is actually heading, this is the guide that does it.